The Definition Of Injection Molding Cooling Time.
Physical and Functional Definition:
Physically, cooling time is the period required for the plastic melt to solidify and reach a specific level of rigidity. The goal is for the part to become strong enough to withstand ejection forces without permanent distortion or loss of dimensional accuracy. This is typically achieved when the material temperature drops to 10–15 °C below its Vicat softening point.
Operational Definition:
On the factory floor, the machine’s “cooling time” setting generally refers to the interval from the end of the holding phase until the mold begins to open. However, it is important to remember that physical cooling starts the moment the hot melt touches the cold mold walls during injection. Therefore, the “actual” cooling duration includes the filling, packing, and holding phases.
Moldflow Simulation Definition:
In Moldflow analysis, cooling time is technically defined as the time it takes for the center layer of the part’s thickest section to reach the material’s freezing temperature. This represents a “worst-case” maximum time, ensuring the entire core is stable.
From an engineering standpoint, cooling is the most significant part of the process, often accounting for 50% to 80% of the total cycle time. A critical rule to remember is that cooling time is proportional to the square of the part’s wall thickness. If you double the wall thickness, the required cooling time generally quadruples.
Understanding Thermal Diffusivity (α): The Physics Behind the Scenes
Introduction of thermal conductivity often gets the spotlight in mold design, the true “silent director” of the injection molding cycle is thermal diffusivity (α). In a process where time is literally money, understanding how heat moves through a part ,rather than just how much heat a material can hold is essential for optimizing productivity and part quality.
The Physical Definition:
Thermal diffusivity (α) describes the efficiency with which thermal energy migrates through a substance relative to that material’s capacity to retain heat. Mathematically, it is established by taking the material’s thermal conductivity and dividing it by the product of its density and specific heat capacity. Within the field of polymer processing, this property is a primary factor in determining how rapidly a plastic’s temperature fluctuates over time, which directly dictates the speed of the cooling rate and the overall duration of the production cycle.
In simple terms, if Thermal Diffusivity (α) is higher, it means:
- Faster Heat Transfer: The material can transfer thermal energy through its mass much more rapidly than it stores it.
- Rapid Temperature Equalization: The temperature of the plastic fluctuates more quickly in response to the cold mold walls.
- Shorter Cooling Duration: In an injection molding context, a higher α directly translates to a faster cooling rate.
- Reduced Cycle Times: Because the part reaches the required ejection temperature sooner, the overall production cycle is shortened.
And vice versa, if Thermal Diffusivity (α) is lower, it means:
- Slower Thermal Migration: Heat energy moves through the material at a much slower rate, as the polymer tends to retain its internal heat longer.
- Insulation Effect: The plastic acts more like an insulator, resisting the rapid temperature changes required for solidification.
- Extended Cooling Duration: In the injection molding process, a low α value is a primary driver of a slow cooling rate, as the “thermal wave” takes longer to reach the mold surface.
- Increased Cycle Times: Because the core of the part stays hot and soft for a longer period, you must keep the mold closed longer to ensure the part reaches a safe demolding temperature.
- Higher Risk of “Hot Spots”: Parts with low thermal diffusivity are more prone to maintaining high internal temperatures, which can lead to warping or sink marks if ejected too early.
Calculation Method and Formula.
α = k / (ρ · Cp)
- k (Thermal Conductivity): The rate at which a material conducts heat from hot to cold. Units: W/m·K or BTU/hr·ft·°F.
- ρ (Density): The mass per unit volume of the material. Units: kg/m³ or g/cm³.
- Cp (Specific Heat): The heat energy required to raise the temperature of a unit mass by one degree. Units: J/kg·K or BTU/lb·°F.
- α (Thermal Diffusivity): The key indicator for cooling speed. Common units: m²/s, cm²/s, or mm²/s.
Typical Vaule Of Most Frequently Used Material .
| Material Category | Material Name | Thermal Conductivity (k) (W/m·°C) | Thermal Diffusivity (α) (mm2/s) | Density (ρ) at Melt Temp (kg/m3) | Specific Heat (Cp) (J/kg⋅°C) |
|---|---|---|---|---|---|
| Plastic Resins | Polycarbonate (PC) | 0.25 | 0.189 | 1052 | 1260 |
| ABS | 0.19 | 0.087 | 930 | 2340 | |
| Polypropylene (PP) | 0.184 | 0.0815 | 781 | 2890 | |
| Nylon 6/6 (PA66) | 0.19 | 0.118 | 964 | 1670 | |
| HDPE | 0.33 | 0.158 | 724 | 2890 | |
| Acetal (POM) | 0.23 | 0.099 | 1149 | 2020 | |
| Rigid PVC | 0.185 | 0.092 | 1230 | 1630 | |
| Mold Materials | Beryllium Copper (Cu 17200) | 259 | 58.9 | 8690 | 506 |
| Aluminum (7075-T6) | 130 | 48.2 | 2810 | 960 | |
| Mold Steel (P20) | 32 | 8.18 | 7820 | 500 | |
| Tool Steel (H13) | 24.3 | 6.77 | 7800 | 460 | |
| Stainless Steel (SS420) | 24.9 | 6.94 | 7800 | 460 |
Key Technical Considerations:
- Thermal Diffusivity (α) Conversion: The values for plastic resins were converted from m2/s (e.g., 8.73×10⁻⁸m2/s for ABS) to mm2/s (0.087 mm2/s) for easier comparison.
- Insulation Effect: Plastics have significantly lower thermal conductivity (k) than metals, which is why the plastic itself often acts as an insulator, slowing the cooling process regardless of how fast the mold can remove heat.
- Mold Material Advantage: Beryllium copper removes heat approximately six times faster than tool steel and eight times faster than stainless steel.
- Effective Thermal Diffusivity (αeff): For semi-crystalline materials like PP and HDPE, the “effective” thermal diffusivity used in calculations may vary based on mold temperature due to the release of latent heat of fusion during crystallization.
Online Thermal Diffusivity (α) Calculator:
Thermal Diffusivity (α) Calculator
Formula: α = k / (ρ · Cp)
Key Factors Influencing Heat Dissipation Efficiency.
In the injection molding cycle, the cooling phase is the most critical stage for both productivity and quality, often accounting for 50% to 80% of the total cycle time. Achieving high heat dissipation efficiency is essential for shortening cycle times, reducing residual stresses, and ensuring dimensional stability. Based on engineering handbooks and technical documentation, the following are the primary factors influencing heat dissipation efficiency:
Fluid Dynamics:
The way the cooling medium moves inside your mold channels is the most significant variable in heat exchange.
Laminar Flow:
When coolant moves in smooth, parallel layers (Laminar flow, Re < 2,100), only the liquid touching the pipe walls actually absorbs heat. The center of the stream moves too fast to be effective.
Turbulence Flow
To maximize efficiency, we must push the coolant into a turbulent state (Reynolds number > 4,000). These vortices break the stagnant boundary layer, improving heat transfer by up to 10 times compared to a slow, smooth flow.
How To Judge Larminar Flow And Turbulanece Flow
A simple way to identify the flow state is to compare the temperature of the coolant at the inlet and the outlet.
Laminar Flow (Inadequate): If the outgoing water is more than 5.5°C (10°F) warmer than the incoming water, the flow is likely laminar. This means the water is moving too slowly to absorb and carry away heat effectively.
Turbulent Flow (Optimal): In a high-efficiency system, the temperature difference should be very small, typically between 2°C to 3°C (4°F to 5°F).
Or You can use physical measurements to verify that the water is moving fast enough to break the boundary layer.
The Linear Velocity Rule: To ensure turbulence is reached, water should generally flow at a linear velocity of approximately 2.5 m/s.
Flow Rate Monitoring: Using inline flow meters (rotameters) allows you to verify the actual volume moving through the pipes. For a standard 0.4-inch diameter cooling line, a flow rate of 1.5 gpm (5.7 LPM) is a common indicator that you have achieved turbulent flow.
Material Selection: Steel vs. High-Conductivity Alloys.
The mold material acts as the bridge between the hot plastic and the cooling water.
- Conductivity Limits: Standard tool steels like H13 are durable but have limited thermal conductivity.
- Cooling Inserts: For “hot spots” like deep cores where water lines cannot reach, using high-conductivity materials like Beryllium Copper or specialized Aluminum alloys is essential. These materials “wick” heat away 5 to 10 times faster than steel, balancing the mold’s temperature.
The Geometry Bottleneck:
The physical desThe Penalty of Thickness: Because polymers are natural insulators, heat struggles to escape from the center of a thick wall. Engineering data shows that cooling time is proportional to the square of the wall thickness. If you double the thickness, you don’t just double the wait—you quadruple it.
Uniformity is Key: A single thick section (a “hot spot”) will dictate the cycle time for the entire part.ign of the part often sets the ultimate limit on how fast we can run.
Cooling Design.
Distance Matters: Channels must be placed as close to the cavity surface as structural safety allows—usually 1 to 2 times the diameter of the hole.
Pitch and Balance: Even spacing (pitch) ensures the surface temperature is uniform across the entire part, which is the best defense against warping and internal stress.
Air Gaps and Maintenance
The Shrinkage Gap: As plastic cools, it shrinks away from the mold wall. This creates a microscopic air gap that acts as an insulator, slowing down heat transfer in the final seconds of the cycle.
Internal Fouling: Over years of service, rust and mineral scale build up inside cooling lines. This “crust” increases thermal resistance and restricts flow. Regular chemical cleaning and using treated water are not just maintenance tasks—they are productivity requirements.
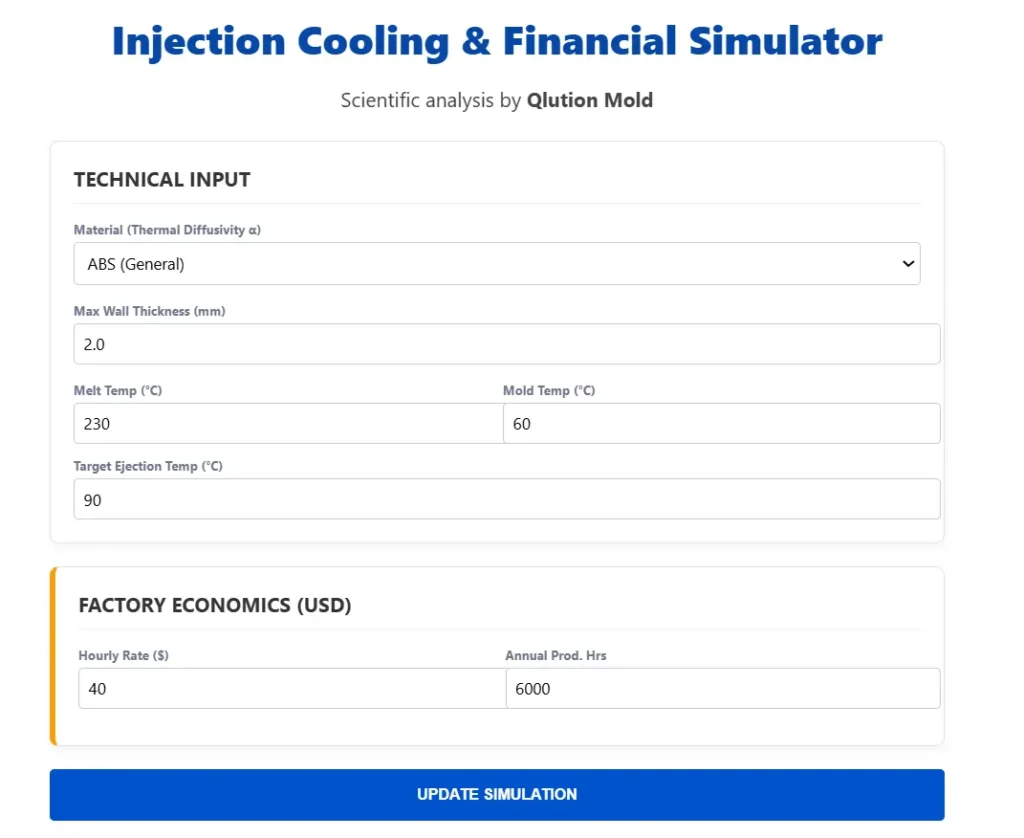
Interactive Simulator: Calculate Your Theoretical Cooling Limit.
Injection Cooling & Financial Simulator
Scientific analysis by Qlution Mold
Potential Annual Gain $0 *Profit increase for every 1s reduction in cooling time
Engineering Insights
The cooling phase typically accounts for 60-80% of the total injection cycle. Calculate your theoretical limit above.