What Is Wall Thickness in Injection Molding?
In simple terms, wall thickness is the thickness of the main “skin” or shell of your plastic part. Think of it as the foundation of your design,every other feature, whether it’s a rib for stiffness, a boss for a screw, or a gusset for support, is built on top of it and proportioned relative to it.
Why Wall Thickness Is the Most Critical Design Parameter.
Wall thickness isn’t just another design spec, it’s the one number that controls everything else in injection molding. It affects how the plastic flows, how long the part takes to cool, how much material you consume, and whether the finished part warps, sinks, or cracks. No other single design decision carries this much weight.
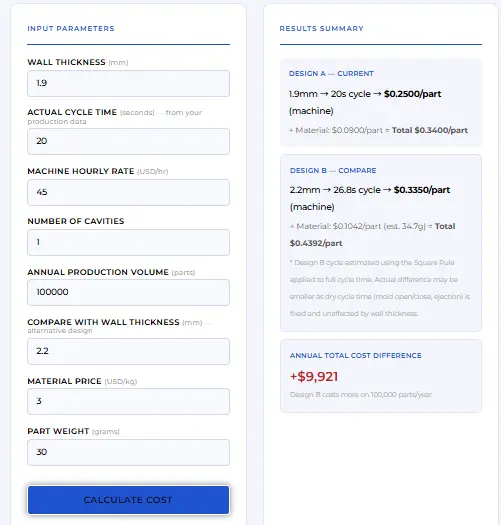
The most direct impact is on cycle time. Cooling typically takes up 50% to 80% of the total molding cycle, and cooling time follows a square relationship with wall thickness. Double the wall, and you quadruple the cooling time. That’s not a minor inefficiency. it cuts your hourly output in half and drives up machine cost per part significantly.
On the quality side, uniform wall thickness is the single most important rule in part design. When walls vary in thickness, they cool and shrink at different rates. The result is warpage, sink marks, voids, and molded in stress that can cause the part to crack or craze long after it leaves the factory. Plastic melt always flows into thicker sections first a phenomenon called race-tracking leaving thin areas underpacked, which creates weld lines, air traps, and short shots.
The common instinct is to add thickness for strength, but experienced designers do the opposite. They use the minimum wall thickness the part needs to function, then add ribs, gussets, and curvature to achieve stiffness. Thicker walls don’t automatically mean stronger parts they often mean longer cycles, more defects, and higher costs with no real performance gain.
Wall thickness directly affects how much a part shrinks after ejection. See our injection molding shrinkage rate guide for material-specific compensation values.
Recommended Wall Thickness by Material (Complete Chart).
Thermoplastic Materials
| Material | Min (mm) | Max (mm) |
|---|---|---|
| ABS | 0.762 | 4.267 |
| Acetal (POM) | 0.381 | 3.175 |
| Acrylic (PMMA) | 0.635 | 6.350 |
| Cellulosics | 0.635 | 4.750 |
| EVA | 0.508 | 3.175 |
| FEP Fluoroplastic | 0.254 | 12.700 |
| Ionomer | 0.635 | 19.050 |
| LCP | 0.203 | 3.048 |
| Nylon PA (Crystalline) | 0.381 | 3.175 |
| Nylon PA (Amorphous) | 0.762 | 3.175 |
| Polycarbonate (PC) | 1.016 | 9.525 |
| HDPE | 0.889 | 6.350 |
| LDPE | 0.508 | 6.350 |
| Polypropylene (PP) | 0.635 | 7.620 |
| PPO | 0.762 | 9.525 |
| PPS | 0.508 | 4.572 |
| Polystyrene (PS) | 0.762 | 6.350 |
| Polysulfone (PSU) | 1.270 | 3.810 |
| TPU | 0.635 | 38.100 |
| Rigid PVC | 1.016 | 9.525 |
| SAN | 0.762 | 6.350 |
Thermoset Materials
| Material | Min (mm) | Max (mm) |
|---|---|---|
| Alkyd (Glass Filled) | 1.016 | 12.700 |
| Diallyl Phthalate | 1.016 | 9.525 |
| Epoxy / Glass | 0.762 | 25.400 |
| Phenolic (General Purpose) | 1.270 | 25.400 |
| Silicone Glass | 1.270 | 6.350 |
Data source: Plastic Part Manufacturing & Material Selection and Product Design Fundamentals
Wall Thickness, Cycle Time, and Machine Cost: The Chain Reaction Every Designer Misses
Wall Thickness and Flow: Understanding the L/T Ratio.
L/t Ratio=Flow length from gate to furthest point/Average wall thicknessFlow length from gate to furthest point
The easiest way to understand the L/t ratio is to think of it as a difficulty index for filling a mold. It answers one question: given how thin the walls are and how far the plastic has to travel, can the material actually reach the end of the cavity before it freezes?
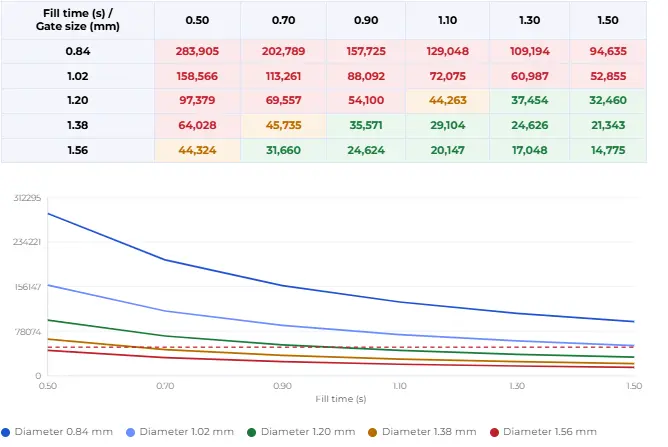
Think of it like water flowing through a pipe. A wider pipe offers less resistance and allows water to travel further. Narrow the pipe, and the resistance increases dramatically not proportionally, but exponentially. Injection molding works the same way. Halve the wall thickness, and the pressure required to maintain the same flow rate increases eightfold, not twofold. This is why wall thickness dominates the filling equation far more than flow length does.
A practical example makes this clear:
- Part A: 2.0mm wall, 200mm flow length → L/t = 100 Easy to fill
- Part B: 1.0mm wall, 200mm flow length → L/t = 200 Significantly harder
- Part C: 0.5mm wall, 200mm flow length → L/t = 400 Beyond standard process limits
Before going further, it is worth clarifying a common misconception. The L/t ratio itself is not a material property, it is a design outcome. It is calculated from two design decisions: how far the plastic has to flow, and how thick the walls are. Both are in the designer’s control.What the material determines is the maximum achievable L/t ratio, the upper limit beyond which that specific resin cannot fill a cavity under standard process conditions. This limit is fundamentally driven by the material’s melt flow index (MFI). Higher MFI means the material flows more easily in its molten state, which allows it to travel further before freezing.
Your design’s L/t = the distance you’re asking the runner to cover
Material’s max L/t = the runner’s physical limit
PP (high MFI) → can run 280–300 units
PC (low MFI) → limit is around 150–175 units
If your track is longer than the runner’s limit,
no amount of coaching (process adjustment) will get them to the finish line.
Thick sections also influence gate placement and fill behavior. Our injection molding gate design guide covers how to position gates to minimize sink marks in thick areas.
Wall Thickness Calculator (Interactive Tool).
Ready to validate your wall thickness with real parts? Our prototype injection molding service delivers first shots in 7–15 days so you can test before committing to production tooling.Prototype Injection Molding
Common Defects Caused by Wrong Wall Thickness.
Incorrect or non uniform wall thickness is the single largest cause of manufacturing failures in injection molding. When wall thickness is poorly planned, it disrupts the two most critical physical processes that determine part quality: balanced melt flow and uniform cooling. The defects that follow are not random,they are predictable, physical consequences of specific design decisions.
Warpage and dimensional distortion:
the most common outcome of non uniform walls. Sections of different thickness cool and shrink at different rates. Thicker sections retain heat longer and continue contracting long after thinner sections have solidified, pulling and twisting the part out of shape on ejection.
Sink marks
Sink marks appear as local surface depressions on the opposite face of a thick protrusion typically where a rib or boss exceeds 50% to 70% of the nominal wall thickness. As the thick mass cools, it shrinks inward. If the outer skin is still soft, the internal contraction pulls the surface down, leaving a permanent dip that is particularly unacceptable on cosmetic faces.
Internal voids
occur when the outer skin solidifies and becomes rigid before the core has fully cooled. Instead of pulling the surface inward, the shrinking core pulls apart from itself, creating a hollow vacuum pocket inside the part. In transparent parts, voids are immediately visible. In structural parts, they create internal weak spots that compromise load bearing performance.
Conclusion:
You have just used the calculator. You know your wall thickness, your L/t ratio, and your rib dimensions. But a calculator can only check what you put in. it cannot see your full part geometry, your gate location, your undercuts, or how your design behaves under real molding conditions.That is what a DFM review is for. Send us your part, and our engineers will go through everything the calculator cannot for free, with no obligation to order. Request a free DFM review.